I thought that it would be a realistic challenge to build my own telemetry system, considering that I had already worked with most of the components I wanted to use.
As I have become a better pilot and experimented with FPV, I'm starting to understand why having some telemetry data could be helpful. I was particularly curious about what altitudes I was reaching and started to research what types of sensors were available.
Choose Your Altitude
I knew that a GPS with adequate sattelite connections would be able to provide altitude, but at the time I hadn't yet experimented with GPS modules and parsing NMEA data. ( a future post )
There is another way to get altitude data that is simpler, cheaper, and understandably less-accurate: by comparing relative differences in air pressure ( assuming a constant temperature ). By establishing a baseline air pressure and temperature at ground level, relative altitude can be approximated from the relative changes in air pressure.
BMP180
An atmospheric pressure sensor popular with hobbyists is the BMP180. SparkFun has great examples of how to hook up and get readings available here. I was pleased to learn that it has its own temperature sensor built in and the whole IC is only about the size of my little fingernail.
After wiring & firing I was able to observe altitude changes as small as 2ft, with some noise. This seemed accurate enough for my purposes.
Requirements
My beginning requirements are basic.
- it has to be lightweight
- transmit telemetry data
- I thought about logging it to SD, but that's not really telemetry is it?
- a receiving station
- multiple (maximum) packets relayed per second
- and display / output / logging of received data
Parts
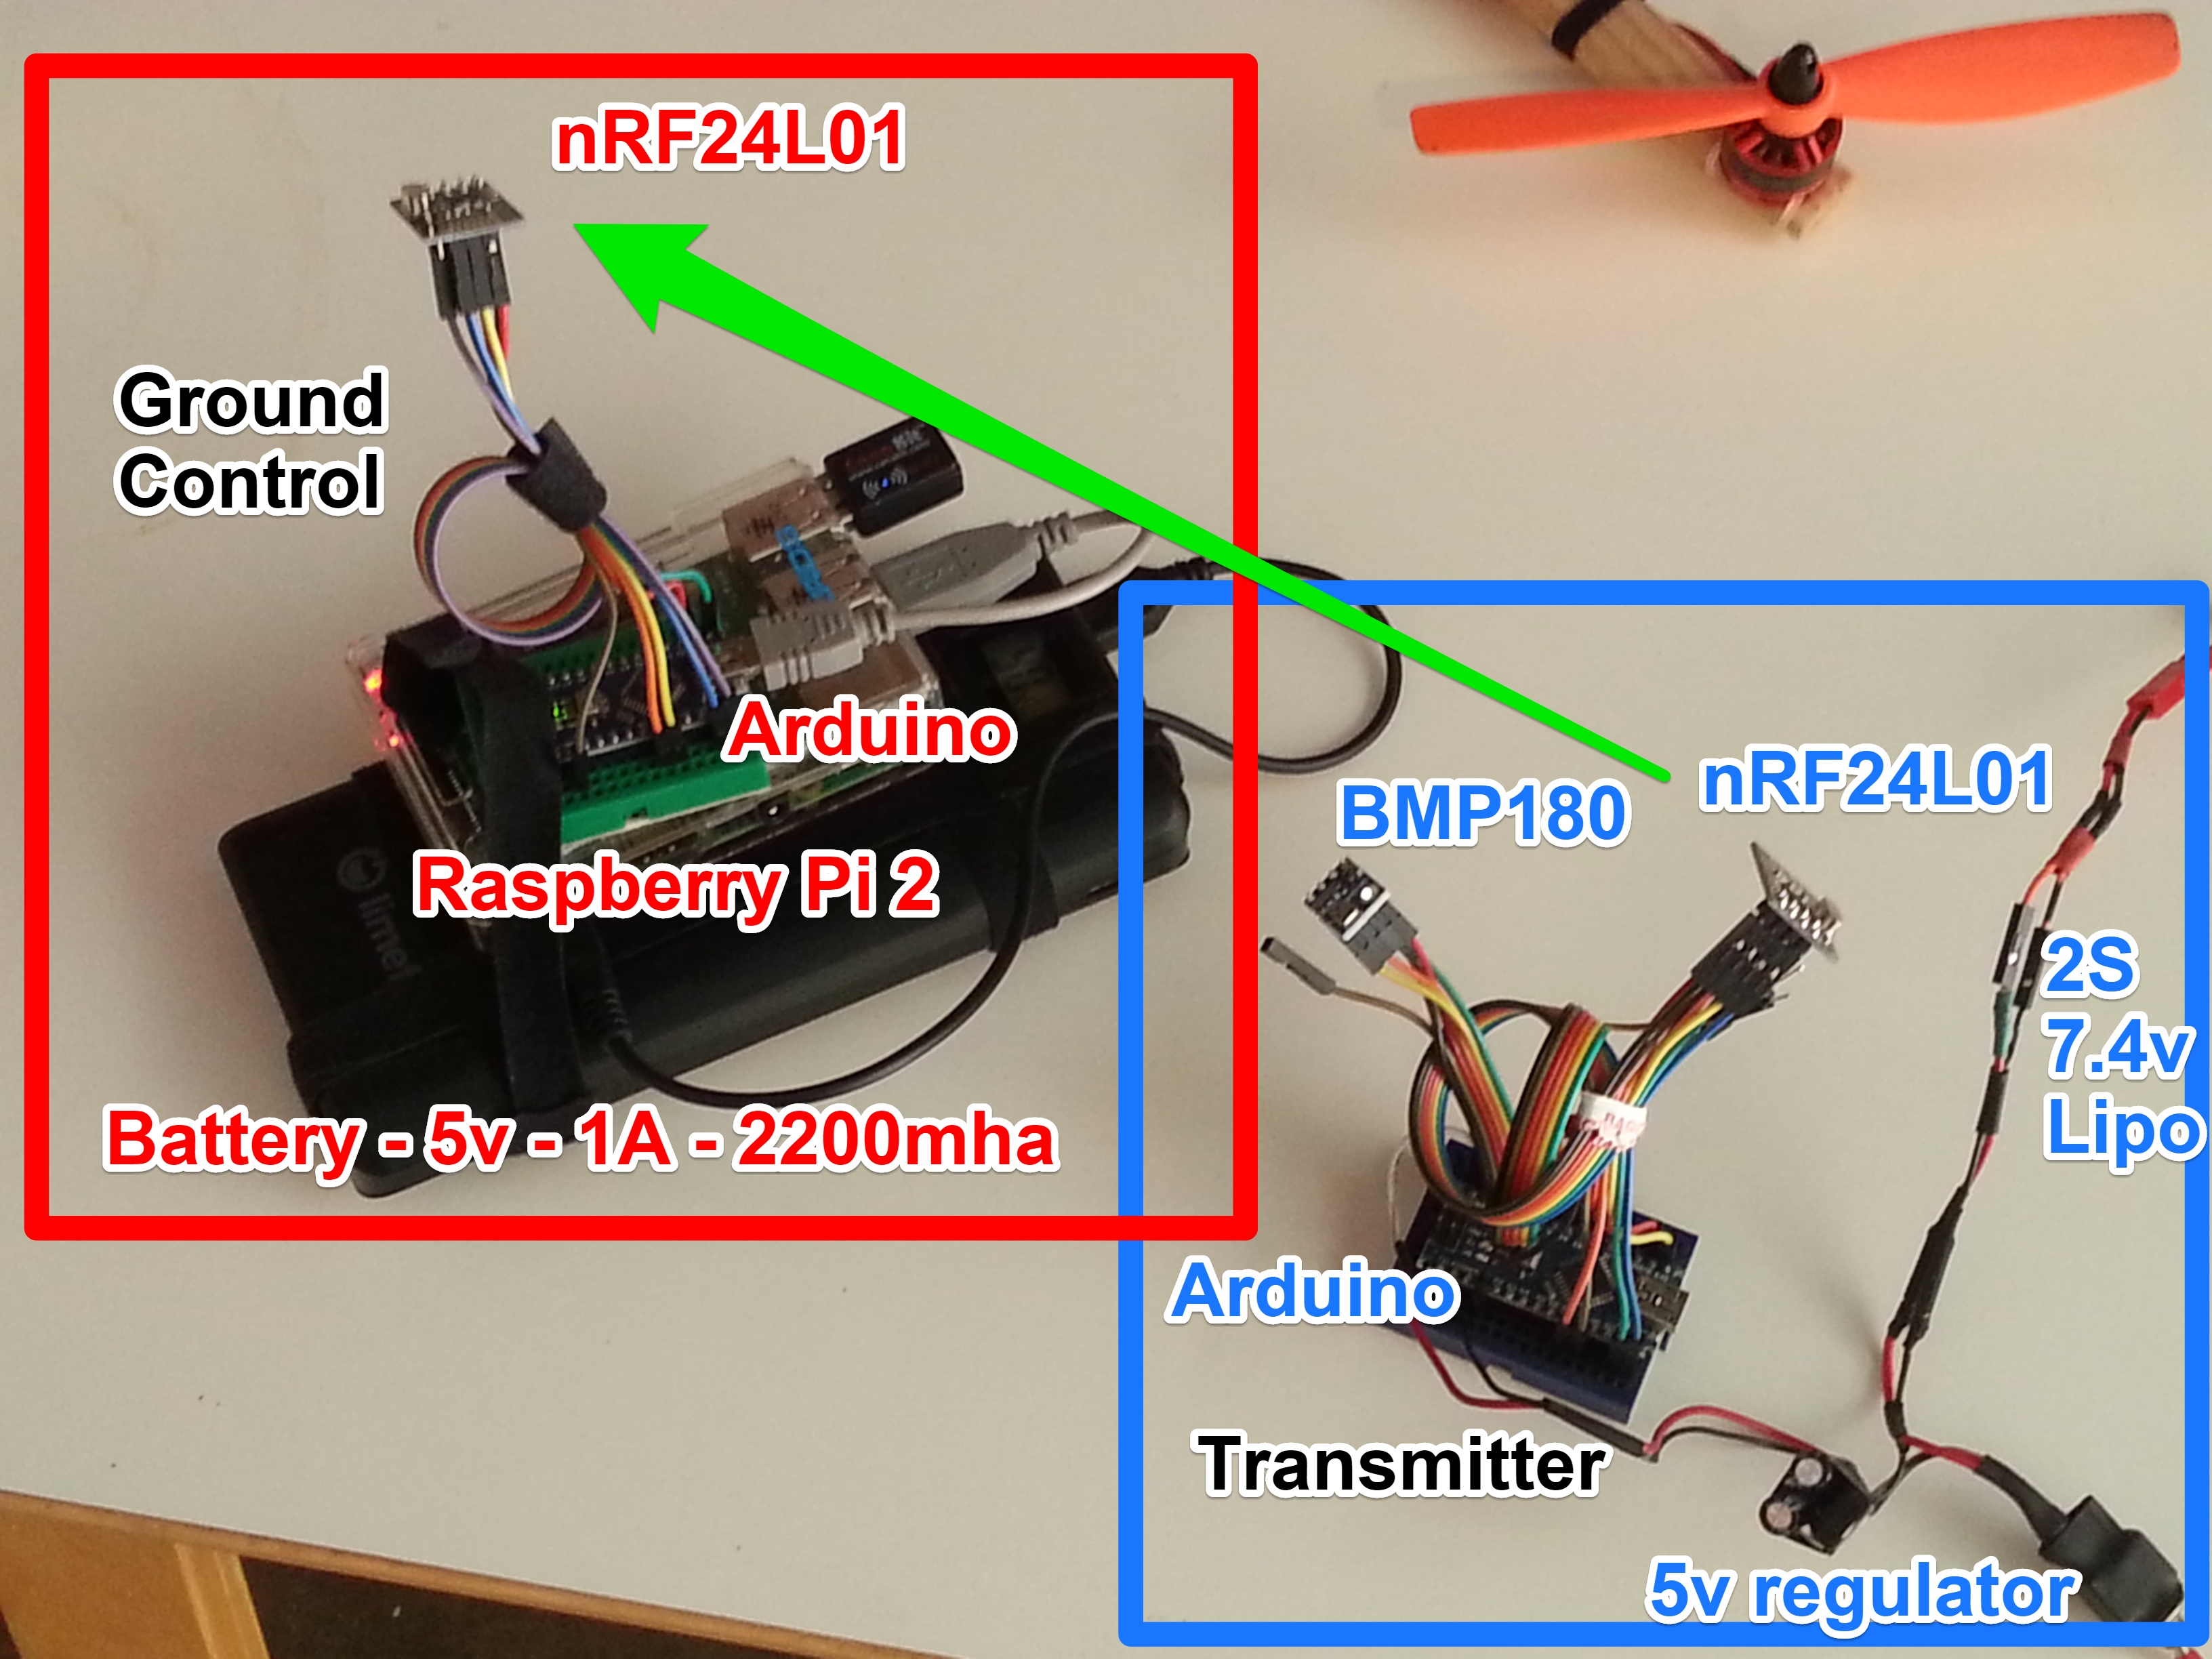
(Remote/Aerial Station) :
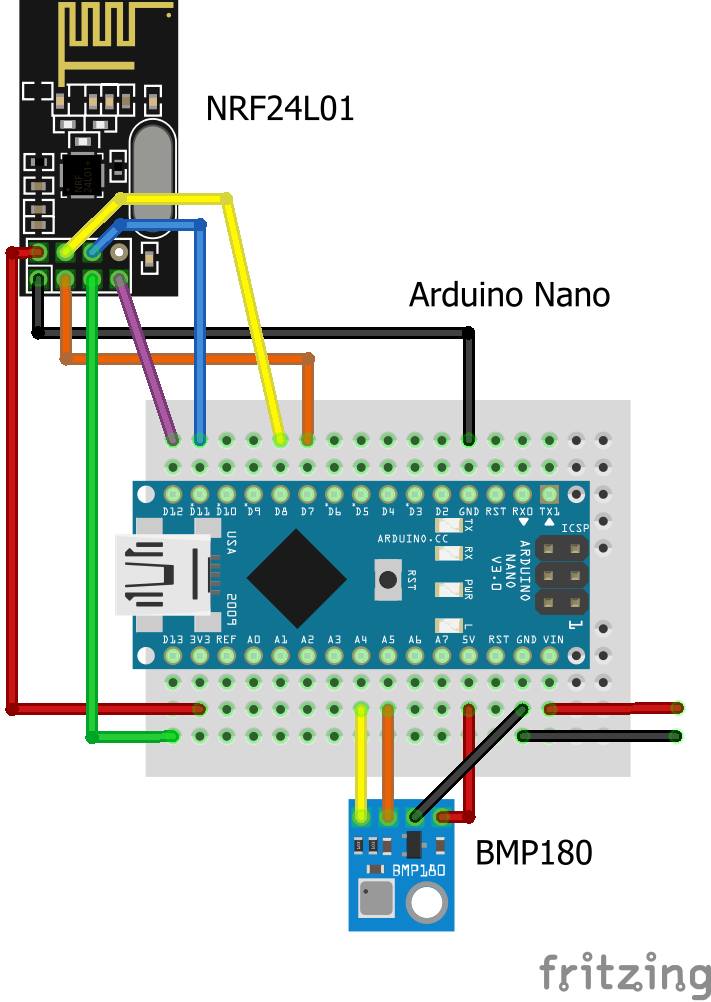
- Arduino Nano in breadboard
- nRF24L01 Transceiver (Transmitting)
- BMP180 Atmospheric Pressure Sensor
- ( battery power is coming from the drone )
(Ground Station / GCS)
- Arduino Nano in breadboard
- nRF24L01 Transceiver (Receiving)
- Raspberry Pi - USB Cable, Wifi Dongle
- ( Wifi network for SSH access to Pi CLI )
- assorted jumper wires, switches, etc
A host computer is necessary to render/upload arduino sketches, and to view and/or log the CGS (serial) output. I'm using a Raspberry Pi 2, because it can be portable and I want it to have line-of-sight to the drone. I then use my phone or laptop to SSH into the Pi over the WiFi network - something I would not be able to do without the Wifi network.
I have all kinds of plans for how the ground control ( receiving station ) features will work, but for now I'll stay focused on the absolute basics.
So the transmitting arduino is wired up with the BMP180 and a script to report out its relative altitude in feet. ( relative meaning "we're +20 feet from where we started!" )
Borrowing Drone Power
It took a minute to figure out how to power the board using the drone's onboard 7.4v ( 2S ) Lipo battery. The script didn't run when I put the full voltage in via the USB - but neither did it damage the board. So I found a 5v regulator that I had created for a previous build and plugged it into the arduino VIN. Success.
I honestly didn't understand whether it was OK to put anything more than 5v into VIN - for any serious people the right answer is somewhere in this guide. Regulating the 5v before putting into VIN did the trick for me.
The receiving end is simpler - just a radio wired up to receive the packets and output the values over the serial (USB). The 'logging' taking place by the Raspberry Pi at this point is just capturing the serial buffer:
cat /dev/ttyUSB0 > flight1.log
First Flight
I was ready for my first telemetry generating flight! This thing looked ridiculous.
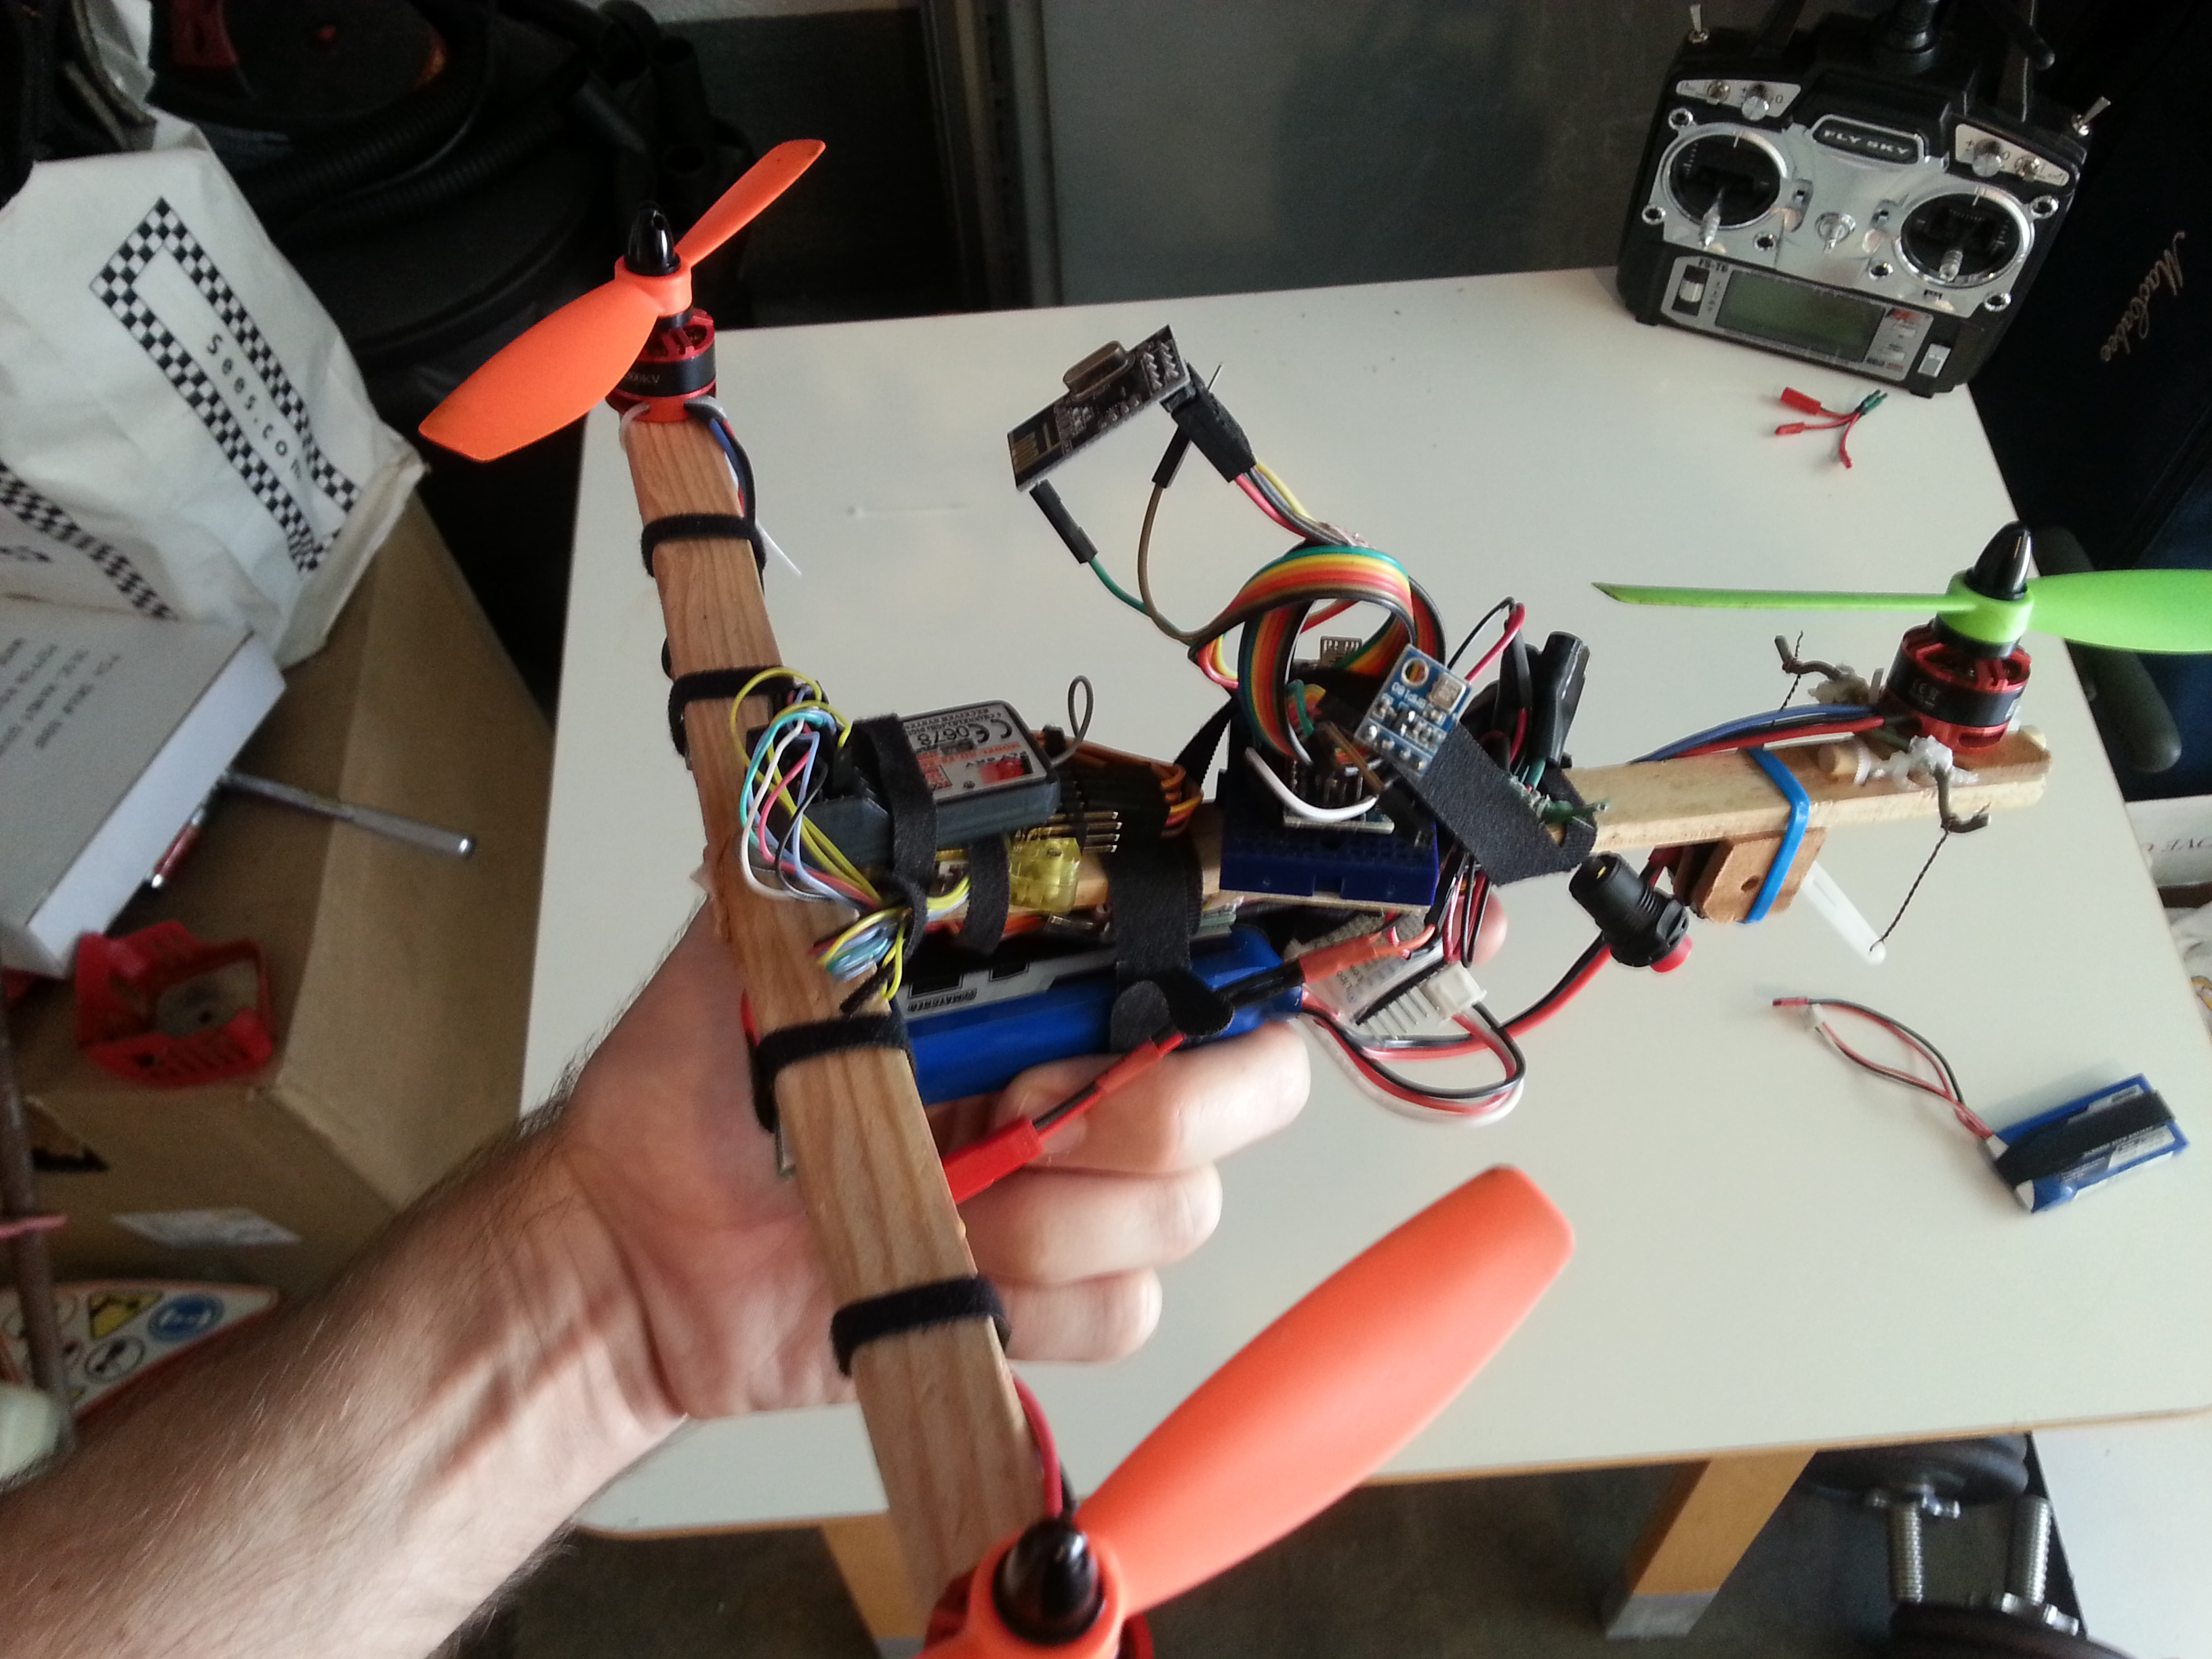
I flew up and down several times, mostly interested in my max altitude. Then it was time to make a graph out of all this data. I chose Excel because I figured it would be the fastest for a proof of concept. In the future I'm hoping to use something fancier.
The x-axis is time (duh), in roughly 500ms (1/2 second) intervals.
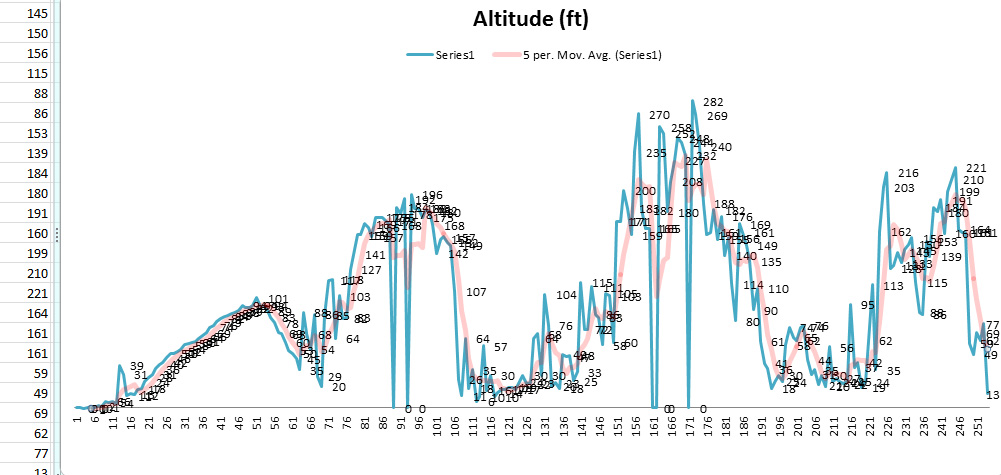
I was pretty pleased. Not only does that look like altitude data, but it is also realistic and lines up with my recollection of the flight. Looks like I also hit almost 300 feet! ( The random dips are like 'dropped packets' ).
Next Steps
There are immediately several things I want to improve.
- Better sensor sampling / averaging
- Increase transmission frequency - more samples / second
- Add more data values to packet: orientation, battery voltage, RSSI
- Switch GCS to using a node/firmata system - so serial data can be piped directly into a node app
- figure out real time display of GCS data
- better graphs - d3 / highcharts / jsgraph