Update 12/2017:
Now that I'm flying FPV all the time, any telemetry data would need to be overlaid on my video signal. Setting up an OSD could be a future topic, because I have plenty to learn.
There is really no need to 'build your own' in this department, a lot of great products are avaiable. In retrospect this was just a fun way to learn about node / serialport / johnnyfive / firmata , and node websockets / highcharts
This has been quite a journey already. More than anything, I'm surprised at how many powerful new tools I've learned about.
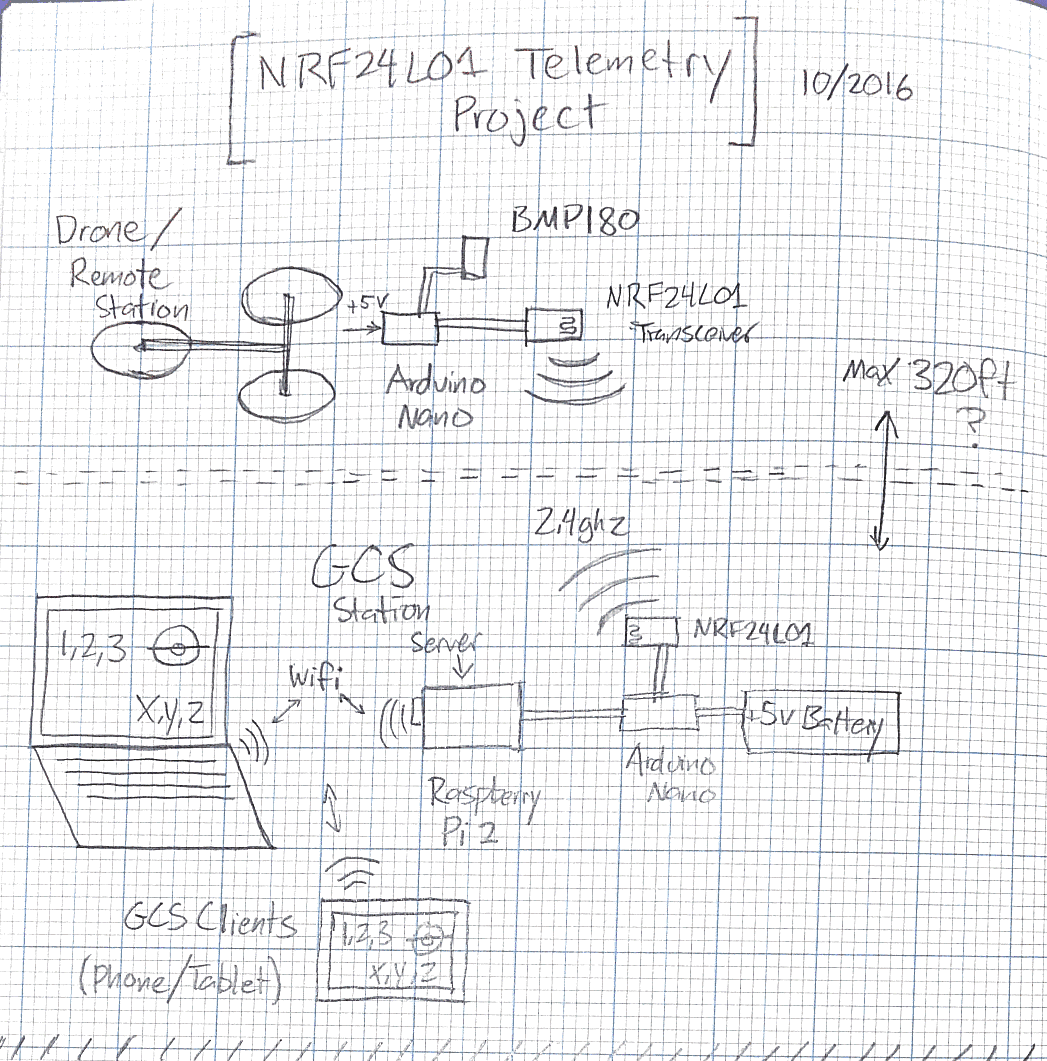
The Whole Picture
This drawing is an attempt to outline the whole telemetry system.
Graphing Flight Logs
From the many available Javascript charting/graphing libraries, I first tried using CanvasJS. It was well documented, and got me off the ground quickly.
Altitude seemed like the most logical thing to graph. I also got around to doing temperature, and average packets per second. Then I threw them all together to get a dashboard
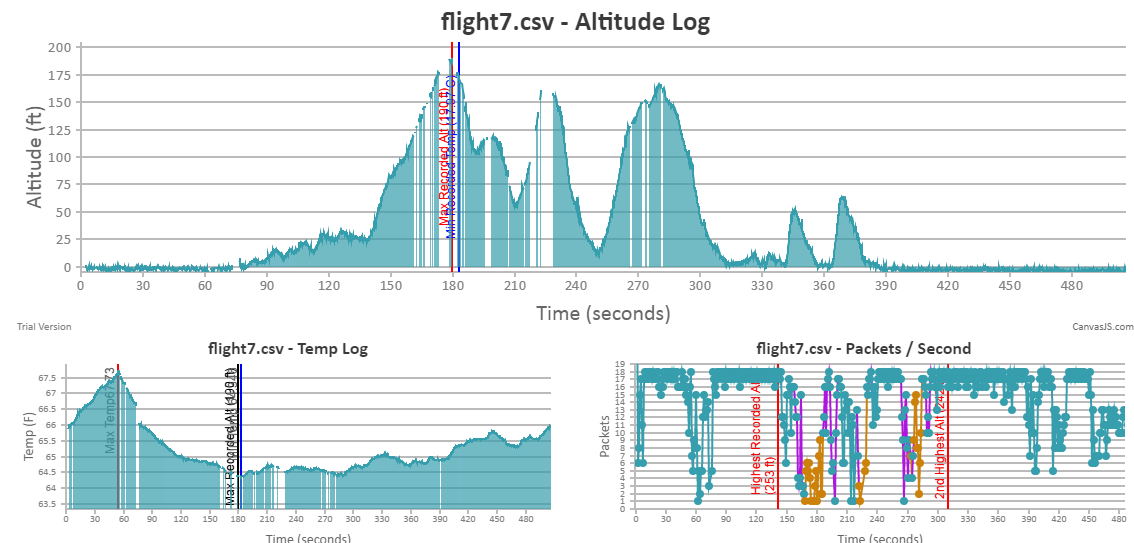
The dropouts are where packets were lost, which you can see correlates to altitude
This is painting a pretty clear picture of the range I'm getting on these nRF24L01 transceivers. I guess it's good that I'm sending so many packets if at times they aren't all being received. It is also interesting to see that packets are being received at such a consistent rate, when within range.
Next, an even higher flight:
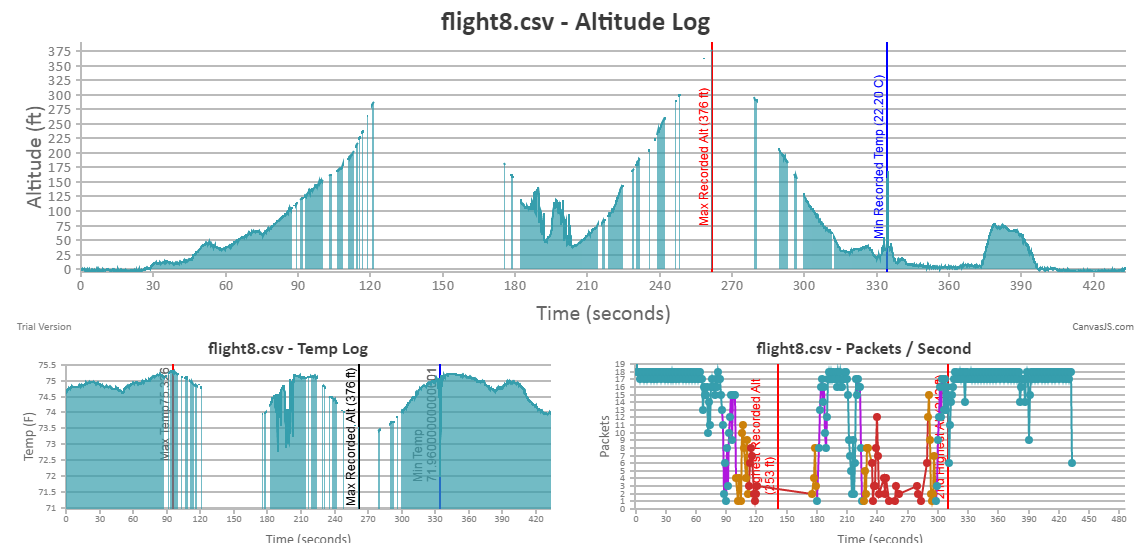
The packets / second should be showing as 0 at points - not a perfect graph
This has been good for my JavaScript also. I wrote a whole class to parse my flight logs and prepare the data for the various charts. The data can be used to control everything from scaling the axes, to changing line color and more.
So this is cool... but I want to watch my data in real time. I can't make a GCS if I can't display data in real time.
NodeBots
On the hardware side, I'm learning how to use Firmata on the Arduino. It allows the board to be controlled by serial commands issued from a host computer ( the Raspberry Pi 2 in this case ).
NodeJS has been a popular framework for interfacing with Firmata, or what most people call 'nodebots' There is a great library called Johnny-Five by Rick Waldron, and he has also provided a stockpile of examples demonstrating how to use every sensor I've worked with and more.
I had dabbled with Node before, so I thought this was a great excuse to learn more.
I grabbed an example for the MPU6050 and decided to graph the output using Highcharts. This is not a very scientific graph, but it was a fun way to learn to use web sockets for high-performance data updates.
Pitch, roll and yaw ( blue ), and rate of change of each axis ( black )
The node server can then be accessed by any client on the network, like a phone or tablet. In the field I might battery power a small wifi AP/router along with the GCS for this purpose.
jQuery Flight Indicators
I'll admit, I got distracted making GUIs for real time data. It's just too much fun.
Hooking up to a great jQuery library allows for some real time gauge read-outs. Using web sockets allows me to update the gauges at 8+ fps, which makes for nice fluid movement. This gif is just an example.
The heading here is actually just the yaw angle, not magnometer data